How To Install and Configure Monit on Linux
Monit ( A Process and Services Monitoring Tool) is a small Open Source utility for monitoring and managing Unix like systems. Monit monitors the server programs to increase services uptime and ensures that they stay online consistently.
This article will help you to install and configure Monit on CentOS, RHEL, Fedora, Ubuntu, Dabian and Scientific Linux. Monit has capability to monitory any of services running on system, We just only need to add settings in it. In this article we will only show you configuration for few services only.
Step 1: Install Monit
Monit can be easily installed with package manager in most of Linux flavors. For CentOS/RHEL users need to enable epel repository in his system before installing it.
On CentOS, RHEL, Fedora and Scientific Linux
# yum install monit
On Debian/Ubuntu
$ sudo apt-get install monit
On Arch
pacman -S monit
Step 2: Enable Web Interface in Monit
set httpd port 2812 and
#   use address localhost
    allow localhost
     allow 192.168.0.0/255.255.255.0
    allow admin:monit
    allow @monit
    allow @users readonly
and start monit service.
# service monit start

Starting monit: monit: generated unique Monit id 0dbd9dc3f0aa7ed7df9e7a069aea9b84 and stored to '/root/.monit.id'  [  OK  ]
As per above configuration monit will start on port 2812 and only accessible from localhost. To change default port simply update first line of above showing configuration and set your preferred port.
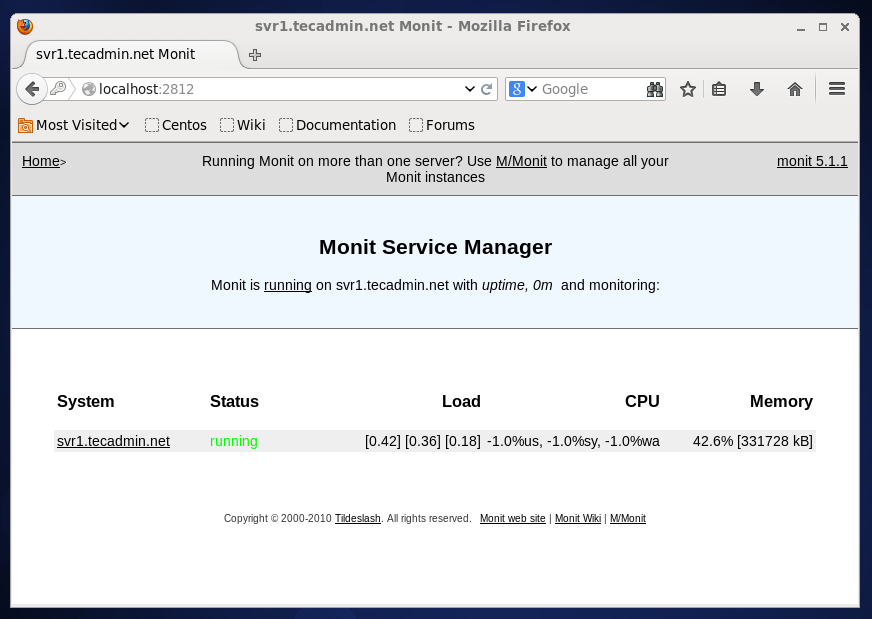
Now access Monit web interface by pointing your browser to 2812 on localhost
Step 3: Configure Monit To Monitor Apache Service
Let’s start with adding services in Monit to monitor them and take necessary action on condition meet. The very first service we are adding Apache. Edit your monit configuration fileand add following settings at end of file
On CentOS, RHEL: /etc/monit.conf
check process apache with pidfile /var/run/httpd.pid
    start program = "/etc/init.d/httpd start" with timeout 60 seconds
    stop program  = "/etc/init.d/httpd stop"
On Dabian/Ubuntu: /etc/monit/monitrc
check process apache with pidfile /run/apache2.pid
    start program = "/etc/init.d/apache2 start" with timeout 60 seconds
    stop program  = "/etc/init.d/apache2 stop"
Now restart monit service using service monit restart and check the status of service using command line.
# monit summary

The Monit daemon 5.1.1 uptime: 2m

Process 'apache'                    running
System 'svr1.tecadmin.net'          running
Step 4: Configure Monit To Monitor MySQL/MariaDB
Let’s add MySQL server in Monit configuration file to monitor it. PID file location and init script may change as per your MySQL version installed.
check process mysqld with pidfile /var/run/mysqld/mysqld.pid
    start program = "/etc/init.d/mysql start"
    stop program = "/etc/init.d/mysql stop"
To Read more about monit configuration exmaples visithttp://mmonit.com/wiki/Monit/ConfigurationExamples
Step 5: Verify Configuration and Test
After adding required services in monit monitoring configuration file, Use the below command to verify syntax of file
# monit -t
Now restart monit service
# service monit restart
Now view the summary of monitoring processes and services by Monit.
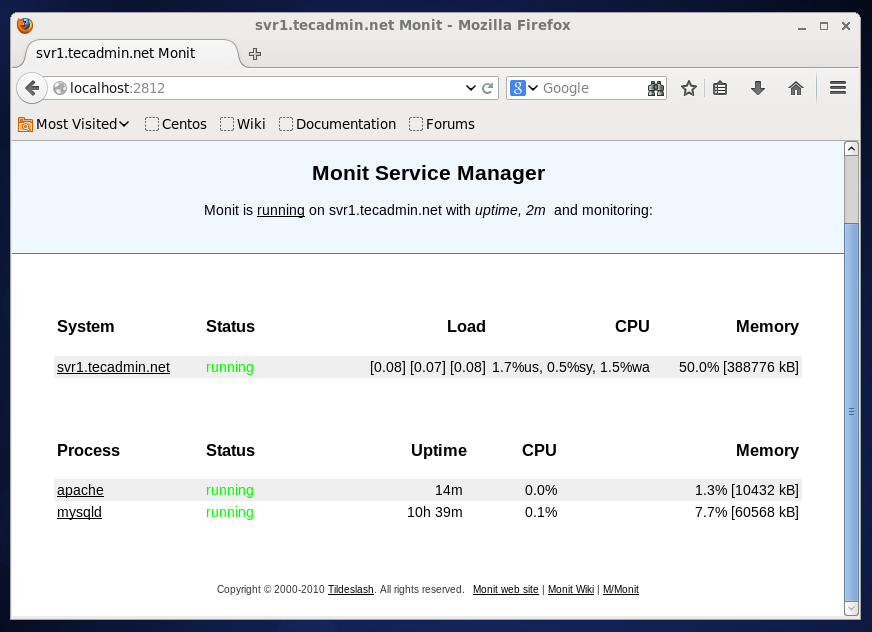
#monit summary The Monit daemon 5.1.1 uptime: 0m Process 'apache' running Process 'mysqld' running System 'svr1.tecadmin.net' running
To view detailed description of each service use the following command
#monit status
[Sample Output]
The Monit daemon 5.1.1 uptime: 1m

Process 'apache'
  status                            running
  monitoring status                 monitored
  pid                               16206
  parent pid                        1
  uptime                            13m
  children                          10
  memory kilobytes                  10432
  memory kilobytes total            65100
  memory percent                    1.3%
  memory percent total              8.3%
  cpu percent                       0.0%
  cpu percent total                 0.0%
  data collected                    Tue Apr 29 03:49:13 2014

Process 'mysqld'
  status                            running
  monitoring status                 monitored
  pid                               1962
  parent pid                        1867
  uptime                            10h 38m
  children                          0
  memory kilobytes                  60568
  memory kilobytes total            60568
  memory percent                    7.7%
  memory percent total              7.7%
  cpu percent                       0.0%
  cpu percent total                 0.0%
  data collected                    Tue Apr 29 03:49:13 2014

System 'svr1.tecadmin.net'
  status                            running
  monitoring status                 monitored
  load average                      [0.00] [0.07] [0.08]
  cpu                               0.2%us 0.1%sy 0.2%wa
  memory usage                      518444 kB [66.7%]
  data collected                    Tue Apr 29 03:49:13 2014
Also we can show the status of processes and services on Monit web interface


Youtube New Update Monetization Enable On Bangladesh,Sri Lanka and Nepal
Trả lờiXóaYoutube New Update Monetization Enable On Bangladesh,Sri Lanka and Nepal
Trả lờiXóa