How to Integrate Zabbix with PagerDuty
Introduction
Zabbix is a very powerful open source enterprise-class network management system designed to monitor the status of network services, servers and other hardware. It’s playing an important role in monitoring IT infrastructure for many organizations.PagerDuty extends Zabbix’s functionality by providing on-call scheduling, alerts and incidents tracking through the PagerDuty API. PagerDuty notifies you of the most critical Zabbix events so that you are able to take immediate action.
This guide describes how to integrate your Zabbix 1.x or Zabbix 2.x installation with PagerDuty using a Python script. This guide will provide instructions on setting up a script, a media type, a user and an action in Zabbix. You might need to slightly alter these instructions depending on your exact Linux distribution and your Zabbix configuration. If you are having trouble completing the installation, please contact us.
Setting up the PagerDuty / Zabbix integration
In PagerDuty:
Create a “Generic API system” service:- In your account, under the Services tab, click “Add New Service”.
- Enter a name for the service and select an escalation policy. Then, select “Generic API system” for the Service Type.
- Click the “Add Service” button.
- Once the service is created, you’ll be taken to the service page. On this page, you’ll see the “Service key”, which will be needed when you configure your Zabbix to send events to PagerDuty.
In Zabbix:
- The PagerDuty plugin for Zabbix requires Python. It will work with Python 2.6 and up. However, it may also work on Python 2.5 with the simplejson module. If you don’t have Python installed on the machine running Zabbix, please follow the instructions here to install Python.
- Download pagerduty.py from GitHub and copy it into Zabbix’s AlertScriptsPath
directory. By default, the AlertScriptsPath is set to be
/etc/zabbix/alert.d; however, it can be changed. If you don’t know your
path, check your zabbix_server.conf file.
wget https://raw.github.com/PagerDuty/pagerduty-zabbix-py/master/pagerduty.py cp pagerduty.py /etc/zabbix/alert.d/ - Make sure the script is executable by Zabbix:
chmod 755 /etc/zabbix/alert.d/pagerduty.py - Now add a cron job that runs every minute to flush Zabbix events
that aren’t yet submitted to PagerDuty. Edit the Zabbix user’s crontab
(you may need to adjust this depending on which user runs Zabbix).
sudo crontab -u zabbix -e - Add the following line to the crontab:
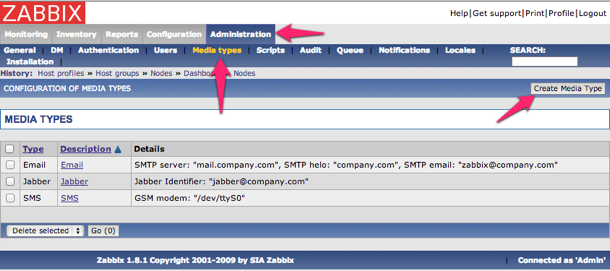
* * * * * /etc/zabbix/alert.d/pagerduty.py - Now, let’s add PagerDuty as a media type in Zabbix. Click on the Administration tab.
- Click on the Media types tab.
- Click on the Create Media Type button.
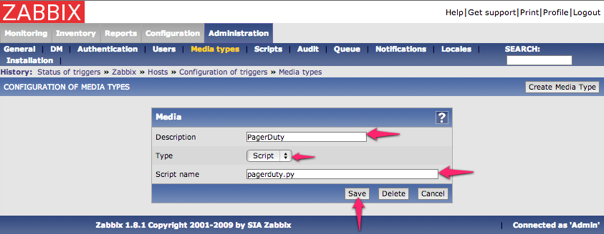
- On the following screen, enter “PagerDuty” for Description.
- Select “Script” for Type.
- Enter “pagerduty.py” for Script name.
- Click Save to create the PagerDuty media type.
- Let’s use this new media type in a user, for the purpose of this
guide, let’s create a new user in Zabbix. Note: You can also modify an
existing user and add the PagerDuty media to them (Step 18).
Click on the Administration tab. - Click on the Users tab.
- Select “Users” from the drop-down list and click on the Create User button.

- Fill in the details of this new user, and call it “PagerDuty User”. The default settings for PagerDuty User should suffice as this user will not be logging into Zabbix.
- Click on the Add button at the bottom.

- On the pop-up window that follows, select “PagerDuty” for Type.

- Paste the Service key from PagerDuty into the text field labeled Send to.
- Change the Status to Enabled.
- Click the Add button.
- Once you are finished with the configuration, make sure to save your
changes. For additional reference on how your setup should look, please
see the screenshot below:

- Go back to Administration > Users. Click on Create Group.

- Enter the name for the Group name (e.g. PagerDuty Service).

- Select the PagerDuty Service user, then click the << button to add them to this group.
- Click on the Add button under Read only to choose which Host Groups will be monitored by PagerDuty.
- Select which Host Groups you would like the PagerDuty to have read access to for monitoring, then click the Select button.

- Click on Create Group to save your new user group.

- Go to Configuration > Actions, and click on Create Action.

- Set the Name to PagerDuty Notifications.
Set the subject to be the following:
trigger for Default subject
resolve for Recovery subject
Set Default message and the Recovery message to the following:
name:{TRIGGER.NAME}
id:{TRIGGER.ID}
status:{TRIGGER.STATUS}
hostname:{HOSTNAME}
ip:{IPADDRESS}
value:{TRIGGER.VALUE}
event_id:{EVENT.ID}
severity:{TRIGGER.SEVERITY}
- Click on New to add a new Action operation.

- Change Send message to single user and select the PagerDuty Service. Then click Add.

- Save your action.
 Congratulations! Your Zabbix should now be integrated with PagerDuty!


Nhận xét
Đăng nhận xét