Understanding Load Average in Linux and when to be worried about it?
Nhận đường liên kết
Facebook
X
Pinterest
Email
Ứng dụng khác
The one of the most important task of any Linux Admin includes performance monitoring which includes a parameter "Load Average" or "CPU Load".
Load Average is the value which
represents the load on your system for a specific period of time. Also
it can be considered the ratio of the number of active tasks to the
number of available CPUs.
How to check?
You can use either top or uptime command to view the load average. The output would look like as shown below $ uptime
00:07:00 up 4 days, 6:14, 1 user, load average: 0.11, 0.14, 0.09
$ top
top - 00:07:12 up 4 days, 6:15, 1 user, load average: 0.09, 0.13, 0.09
What are the three values?
As you can see three values representing the load average column. These
show the load on your system over a significant period of time (one or
current, five and fifteen minutes averages).
How do you know your system has a high load?
The most important question as in most cases I have seen how do you determine your system has high load. Does a high value represents high load average and that your system requires atention? What is the threshold value for load average? How can we conclude if the load average value is good or bad?
Before I answer these question first let us understand about multi core and multi processor CPU.
A Central Processing Unit in earlier days used to be having only one
processor and the core concept was not their in those days. But with the
advancement in technology and the urge of higher speed to meet up
demands of IT industry multiple processor were integrated in the same
CPU making it multi-processor.
However increasing the no. of processor did increased the working speed
of many tasks and performance but it also leads to increase in size,
complexity and heat issues. So, in order to continue improvement of
performance the core concept was introduced.
Instead of having two CPUs and a motherboard capable of hosting them,
two CPUS are taken together and combined to form a dual core processor
which will utilize an individual socket using less power and size
capable of performing the same amount of task as dual processor CPU.
Bottom Line is that Load value depends on the no. of cores in
your machine. For example a dual core is relevant to 2 processor or 2
cores and quad core is relevant to 4 processor or four cores as the
maximum value for load.
How do I check the no. of cores on my Linux system?
The information which you see under /proc/cpuinfo can be confusing at times. If you run the below command $ less /proc/cpuinfo | grep processor
processor : 0
processor : 1
processor : 2
processor : 3
processor : 4
processor : 5
processor : 6
processor : 7
processor : 8
processor : 9
processor : 10
processor : 11
processor : 12
processor : 13
processor : 14
processor : 15
So as per the above command my system has 16 processors in it. However
it really has 8 processors with hyper threading enabled. The hyper
threading presents 2 logical CPUs to the operating system for each
actual core so it effectively doubles the no. of logical CPU in your
system
How to find if hyper threading is enabled
Look out for "ht" in the flags section inside cpuinfo with the below command $ less /proc/cpuinfo | grep flags | uniq | grep -i "ht"
flags : fpu vme de pse tsc msr pae mce cx8 apic sep mtrr pge mca cmov pat pse36 clflush dts acpi mmx fxsr sse sse2 ss ht tm syscall nx rdtscp lm constant_tsc nonstop_tsc pni monitor ds_cpl vmx est tm2 ssse3 cx16 xtpr sse4_1 sse4_2 popcnt lahf_lm
Next let us continue on the calculation of no. of core
The fields we need to compare to find the no. of core are "physical id" and "core id". Run the below command $ less /proc/cpuinfo | grep "physical id" | sort|uniq | wc -l
2
$ less /proc/cpuinfo | grep "core id" | sort|uniq | wc -l
4
So the no. of cores would be 2x4 = 8 cores
Coming back to our primary question
Understanding Load Average
If the number of active tasks utilizing CPU is less as compared to
available CPU cores then the load average can be considered normal but
if the no. of active tasks starts increasing with respect to available
CPU cores then the load average will start rising.
For example in my case I can see $ uptime
00:43:58 up 212 days, 14:19, 4 users, load average: 6.07, 7.08, 8.07
So as per the no. of cores I calculated i.e 8 cores and seeing the value
6.07 I shouldn't be worried much unless it crosses the red line value
i.e. 8 for my case.
Microsoft's SQL Server Management Studio will connect by default to port 1433 and there's nowhere in the connect dialog to specify a different port from the default. To connect using a different port specify the servername, a comma, and then the port number as shown in this post. Connect using a different port using a comma The connection dialog in the SQL Server Management Studio client is shown in the screenshot below. Normally you would just type the server name into field but to specify a different port use a comma then the port number. The example screenshot above shows " 192.168.50.166\SQLSERVER2012 " as the instance name and "port" where the port would be. 192.168.50.166\SQLSERVER2012,1343 Then specify the login credentials, click the connect button, and assuming everything is correct it should then connect to the SQL Server. Setup specific port for SQL Server: Link: http://msdn.microsoft.com/en-us/library/ms177440.aspx
My Zabbix database size increased a lot in the last few months and since my disk was running out space, I decided to clean up the old events from the database. Looking at the database tables, the biggest one was history_uint , which holds the items history data – over 400 millions of records and over 30 Gb of disk space before the clean up. Since deleting the old records from this table directly would be a very slow process, I decided to create a new table and insert the latest records from the history_uint table and then just replace the old table with a new one. Since this is not an offical procedure, use it at your own risk. Environment: Zabbix v2.2 MySql 5.1 – InnoDB with innodb_file_per_table=ON Step 1 – Stop the Zabbix server Step 2 – Open your favourite MySQL client and create a new table CREATE TABLE history_uint_new LIKE history_uint; Step 3 – Insert the latest records from the history_uint table to the...
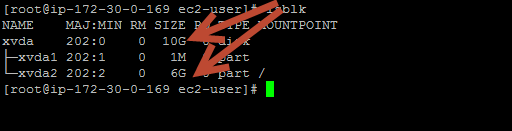
I create new server with 10GB of HDD, but when i check on the command line, the root space only show 6GB. I'm using t2.micto and Redhat 7.0, disk type: XFS. - xvda1: boot partition - xvda2: root partition Fix Step: We have instance A with the volume VA. 1) Stop the current instace A 2) Snapshot the current volume VA of the instance A 3) Start the instance A 4) Create new volume with 25GB by using the snapshot of volume VA then we have new volume VB 5) Attach the new volume VB to the instance A as default (/dev/sdf) 6) From the ssh console, i use the lsblk command to list the disk. # lsblk 7) Using the xfs_repair to repair the /dev/xvdf2 ( yum install xfsprogs) # xfs_repair /dev/xvdf2 8) Continue as the image below 9) Remove the /dev/xvdf2, remember the start of this disk then we will create the new one with the same. 10) Using XFS command to repair the /dev/xvdf2 again. # xfs_repair /dev/xvdf2 11) Use the lsblk co...

Load Average is the value which represents the load on your system for a specific period of time. Also it can be considered the ratio of the number of active tasks to the number of available CPUs.
How to check?
You can use either top or uptime command to view the load average. The output would look like as shown below$ uptime
00:07:00 up 4 days, 6:14, 1 user, load average: 0.11, 0.14, 0.09
$ top
top - 00:07:12 up 4 days, 6:15, 1 user, load average: 0.09, 0.13, 0.09
What are the three values?
As you can see three values representing the load average column. These show the load on your system over a significant period of time (one or current, five and fifteen minutes averages).How do you know your system has a high load?
The most important question as in most cases I have seen how do you determine your system has high load.Does a high value represents high load average and that your system requires atention?
What is the threshold value for load average?
How can we conclude if the load average value is good or bad?
Before I answer these question first let us understand about multi core and multi processor CPU.
A Central Processing Unit in earlier days used to be having only one processor and the core concept was not their in those days. But with the advancement in technology and the urge of higher speed to meet up demands of IT industry multiple processor were integrated in the same CPU making it multi-processor.
However increasing the no. of processor did increased the working speed of many tasks and performance but it also leads to increase in size, complexity and heat issues. So, in order to continue improvement of performance the core concept was introduced.
Instead of having two CPUs and a motherboard capable of hosting them, two CPUS are taken together and combined to form a dual core processor which will utilize an individual socket using less power and size capable of performing the same amount of task as dual processor CPU.
Bottom Line is that Load value depends on the no. of cores in your machine. For example a dual core is relevant to 2 processor or 2 cores and quad core is relevant to 4 processor or four cores as the maximum value for load.
How do I check the no. of cores on my Linux system?
The information which you see under /proc/cpuinfo can be confusing at times. If you run the below command$ less /proc/cpuinfo | grep processorprocessor : 0
processor : 1
processor : 2
processor : 3
processor : 4
processor : 5
processor : 6
processor : 7
processor : 8
processor : 9
processor : 10
processor : 11
processor : 12
processor : 13
processor : 14
processor : 15
So as per the above command my system has 16 processors in it. However it really has 8 processors with hyper threading enabled. The hyper threading presents 2 logical CPUs to the operating system for each actual core so it effectively doubles the no. of logical CPU in your system
How to find if hyper threading is enabled
Look out for "ht" in the flags section inside cpuinfo with the below command
$ less /proc/cpuinfo | grep flags | uniq | grep -i "ht"flags : fpu vme de pse tsc msr pae mce cx8 apic sep mtrr pge mca cmov pat pse36 clflush dts acpi mmx fxsr sse sse2 ss ht tm syscall nx rdtscp lm constant_tsc nonstop_tsc pni monitor ds_cpl vmx est tm2 ssse3 cx16 xtpr sse4_1 sse4_2 popcnt lahf_lm
Next let us continue on the calculation of no. of core
The fields we need to compare to find the no. of core are "physical id" and "core id". Run the below command
$ less /proc/cpuinfo | grep "physical id" | sort|uniq | wc -l

2


$ less /proc/cpuinfo | grep "core id" | sort|uniq | wc -l

4
So the no. of cores would be 2x4 = 8 cores
Coming back to our primary question
Understanding Load Average
If the number of active tasks utilizing CPU is less as compared to available CPU cores then the load average can be considered normal but if the no. of active tasks starts increasing with respect to available CPU cores then the load average will start rising.For example in my case I can see
$ uptime00:43:58 up 212 days, 14:19, 4 users, load average: 6.07, 7.08, 8.07
So as per the no. of cores I calculated i.e 8 cores and seeing the value 6.07 I shouldn't be worried much unless it crosses the red line value i.e. 8 for my case.
I hope I made myself clear